

To A/B test product images usefully, decide what happens after the click. A new lamp image might attract more buyers while setting an inaccurate expectation about its size. Purchase conversion would capture the first effect; linked, fully observed returns would help you investigate the second.
Start with one image placement, a controlled comparison, and a record connecting assigned visitors to orders and subsequent physical returns. This guide offers a practical test brief and decision framework. It does not promise that generated images increase sales or reduce returns.
For image creation, use our AI product photography guide. Here, the task is measuring what a specific image change does on a specific shopping surface.
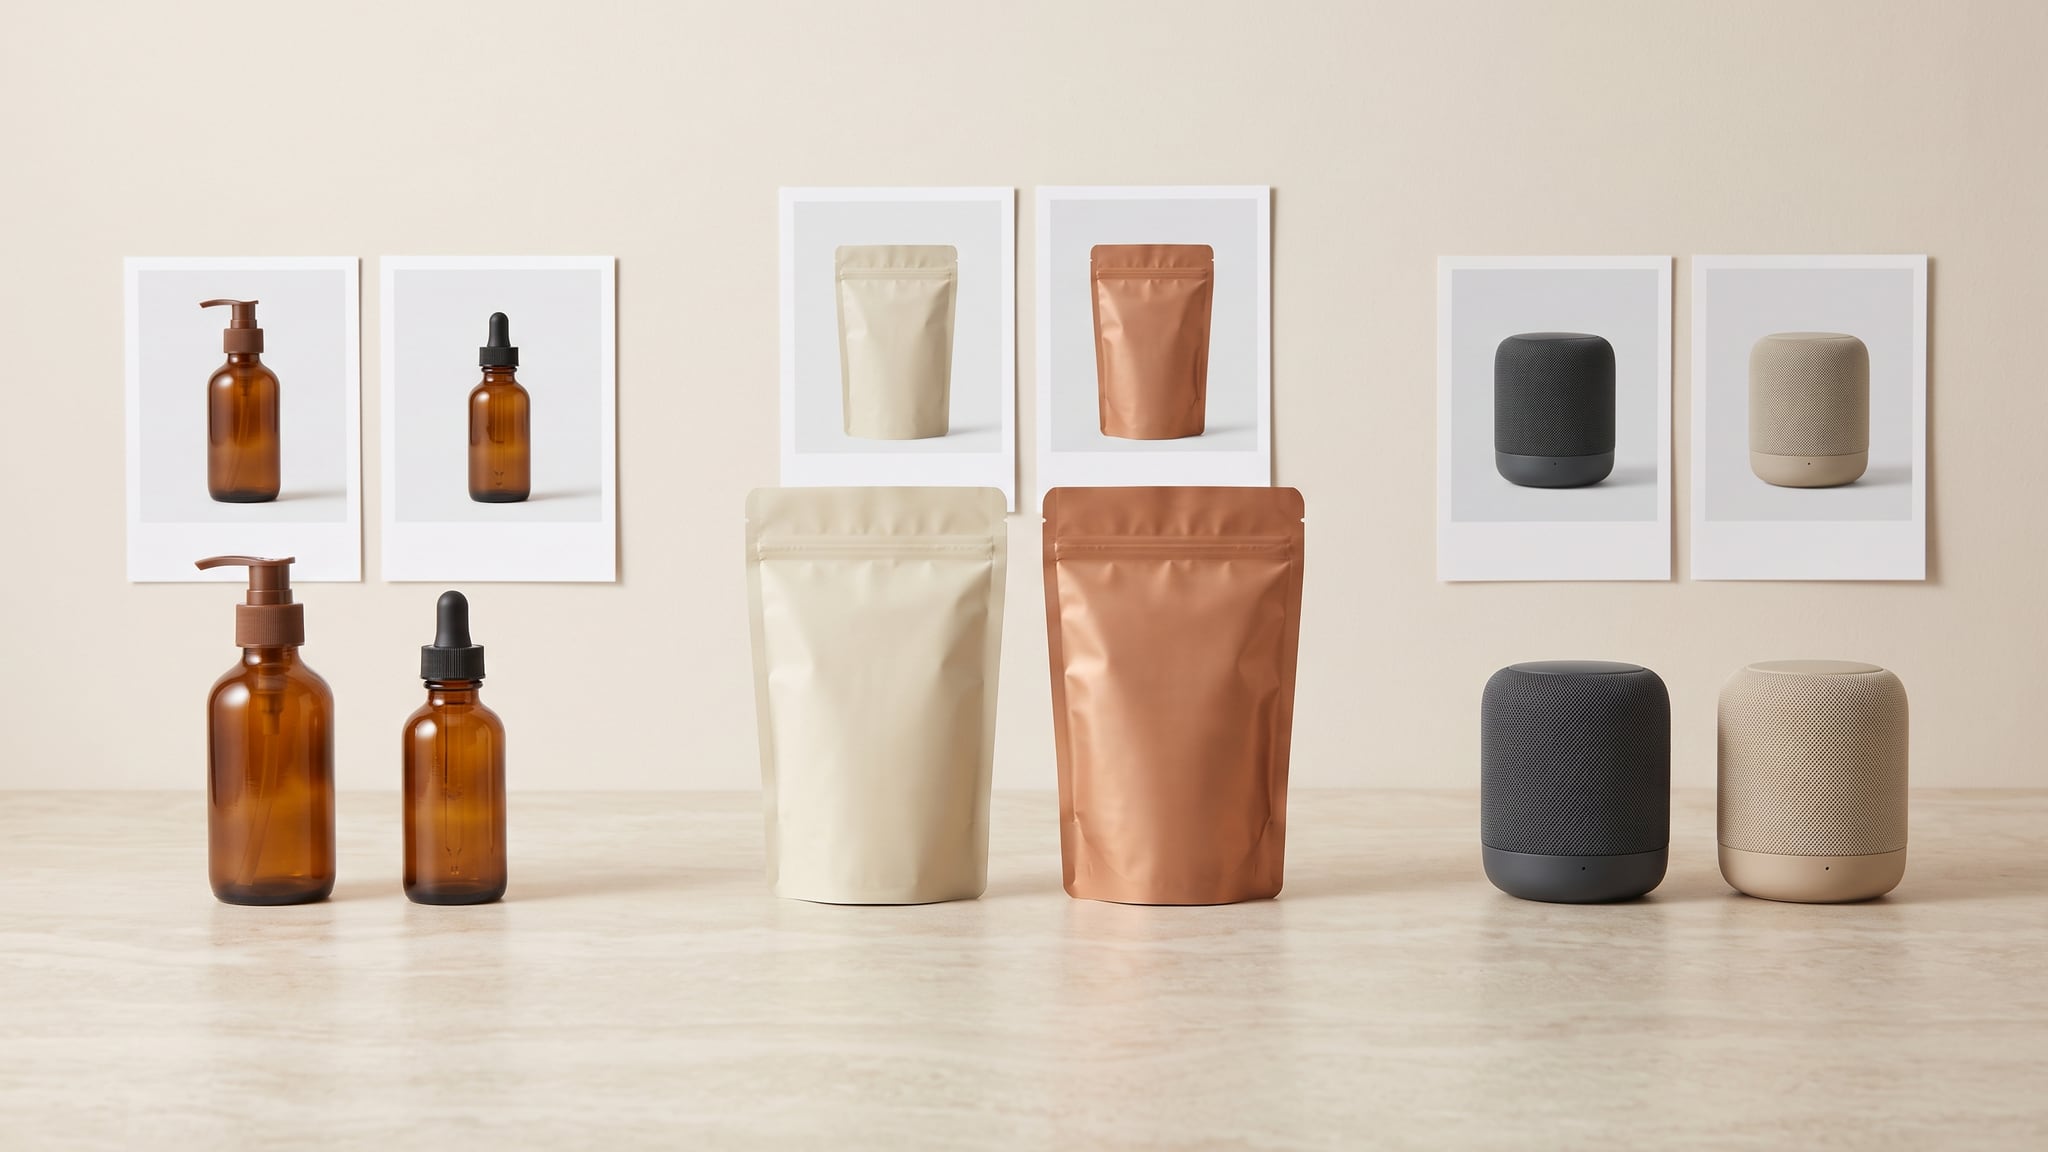
The cover is an AI-generated conceptual editorial illustration, not an experiment result or a matched pair of controlled test photographs. All product scenarios and numerical examples below are hypothetical.
Choose the surface before choosing the metric
An advertising image, a marketplace detail-page image, and a storefront gallery image reach people at different stages. Their results answer different questions.
| Surface | Define the comparison | Keep the conclusion within scope |
|---|---|---|
| Paid advertisement | Image creative within a supported randomized ad experiment | Clicks describe ad response; purchases require the experiment's conversion measurement |
| Marketplace detail page | Eligible product-page content experiment | Results concern the tested page content and eligible audience |
| Owned storefront | One supported image slot with controlled assignment | Measure the specified visitors or sessions and their downstream outcomes |
Amazon's Manage Your Experiments documentation describes randomly dividing detail-page shoppers and reporting conversion, units sold, sales, units per unique visitor, and sample size. Its listed experiment metrics do not document a variant-level physical-return measure. Do not assume one is available because the page discusses customer returns elsewhere.
Shopify's native theme experiment analytics list session conversion, bounce, checkout-reached, and add-to-cart rates. The available metrics cannot be customized and do not list physical returns. Confirm that your proposed image placement can be changed through a supported experiment setup; editing product media alone does not establish randomized delivery. Check the current rollout requirements and limitations before planning implementation.
An ad winner is a candidate for a separate product-page test. Moving it to the gallery changes the question and audience.
Prepare two accurate candidates with one intended difference
Write a hypothesis that describes a customer question. For example: “A closer crop in the second lamp-gallery slot makes the switch easier to see and may change purchase decisions.” Version A is the current crop; B is a closer crop of the same approved image. Keep the other gallery slots unchanged.
Other testable questions include whether a coffee-pouch front is easier to inspect against a simpler background, or whether a supported earbuds view clarifies the charging-case opening. Pick one question per test. Changing the background, angle, copy, and included accessories together tests a package of changes, not an isolated image choice.
Both candidates must pass SKU-level product accuracy checks. A cosmetic bottle with the wrong dispenser is a defect to correct before launch. Customer exposure is not an acceptable way to validate invented product details.
Use the Oxava studio to create candidate visuals, then review and download the selected files. Assignment, purchase tracking, and return analysis belong in your experiment and commerce tools; Oxava is not the A/B analytics system in this workflow.
Build a measurement contract from assignment to returns
Before launch, prove that your records can follow this chain:
Eligible shopping visit → randomized assignment → image-delivery record → attributed order line → matured physical-return outcome.
Define eligibility using information available before the image can influence behavior. For a gallery test, that might be visitors entering the chosen product page in a specified market. Do not retrospectively keep only people who opened the gallery: the image can affect that action, changing who enters your analysis.
Use a stable assignment identifier so returning visitors remain in their original arm where the system supports it. Document what happens across devices, browsers, consent states, and logged-out visits. If the platform uses sessions instead, retain its session definition and label the result accordingly. Do not relabel session conversion as visitor conversion.
Your records need at least:
- Experiment ID, assignment unit, arm, assignment timestamp, and eligibility rule
- SKU, exact image version, tested slot, and a delivery or exposure diagnostic
- Order ID, line-item ID, purchase and delivery timestamps, ordered quantity, and attribution rule
- Return-event ID, linked order line, physically returned quantity, and processing date
- Follow-up cutoff, maturity status, and missing-link status
Use permitted pseudonymous identifiers and existing access controls. A spreadsheet can summarize these records, but it cannot reconstruct an assignment that was never captured. Check for duplicated order lines and return events before aggregating.
If assignment cannot be linked to order lines and their returns, you cannot attribute returns to A or B. You may report overall store returns as background context, with that limitation. Matching two calendar totals is insufficient.
Copy this brief to A/B test product images
Complete these fields before you see results. The example is a planning template, not a tested campaign.
| Field | Example or decision to record |
|---|---|
| Question | Does a closer crop of the lamp switch change purchasing? |
| Surface and scope | Second gallery slot, one lamp SKU, selected market |
| A and B | Fixed, reviewed image IDs; crop is the only intended change |
| Assignment | Concurrent randomized split; document unit and persistence |
| Primary outcome | Share of assigned eligible visitors purchasing the target SKU within the chosen attribution window |
| Guardrails | Physical-return rate, image-delivery failures, product-accuracy complaints |
| Constants | Price, offer, copy, shipping promise, other images, and availability |
| Analysis plan | Meaningful effect, uncertainty method, planned duration or valid sequential stopping rule |
| Return follow-up | Delivery-based observation window, processing allowance, final cutoff |
| Owner and action | Named analyst; adopt, retain, investigate, or record inconclusive |
Choose the smallest change worth acting on before estimating the required sample. Base planning on your own baseline conversion, traffic, and acceptable uncertainty. Returns may need substantially longer observation than purchases; make room for that in the decision date.
Define purchases, physical returns, and retained units
For a visitor-based custom analysis, use purchasing assigned visitors / all assigned eligible visitors for purchase conversion. Count a visitor once in that numerator even if they place several orders. For a platform report, preserve its documented denominator instead of silently substituting this one.
Define the physical-return rate as physically returned target-SKU units / ordered target-SKU units for the same attributed, fully observed order cohort. State how cancellations, exchanges, replacements, and partially returned orders are handled. An order with two units and one returned unit contributes one returned unit out of two, not one returned order out of one.
Shopify's sales-report definitions distinguish physical returned quantity from reversed quantity, which also includes refunds, cancellations, and edits. Reversals appear on their processing dates. Consequently, a month's reversals divided by that month's orders does not establish an experiment-cohort physical-return rate.
A useful additional outcome is retained target-SKU units per assigned eligible visitor. For a cohort with no cancellations or exchanges, retained units equal ordered units minus physically returned units. For real operations, reconcile cancellations and exchanges separately so unfulfilled orders and replacement units do not inflate the count.
The return rate is conditional on buying. A new image can change who buys, so it is not by itself a causal estimate among an identical set of customers. Pair it with an outcome using the original randomized denominator, such as retained units per assigned visitor.
Wait for comparable return observation
Give each order the same opportunity to produce a recorded return. Your window should reflect the applicable return policy, delivery timing, and normal processing delay. Specify the starting event, such as delivery, rather than counting an arbitrary number of days from the experiment launch.
Imagine the test stops accepting visitors on October 20. An order delivered on October 24 remains immature until its defined follow-up and processing allowance finish. Treating “no return yet” as “kept” on October 25 would overstate retention.
Keep a cohort table with arm, order week, ordered units, mature units, returned units, and unresolved records. Compare equally mature cohorts at an interim review, label that subset, and retain the original assignments. Wait for the remaining orders before presenting the planned final result.
Track why products came back. “Color different from image” can guide a visual investigation; “arrived damaged” points toward another operational question. Return reasons are diagnostic evidence, not proof that the image caused an individual return. Preserve missing reasons as unknown.
Run both versions together and protect the test
Run A and B concurrently with randomized assignment. Using A this week and B next week leaves the comparison exposed to promotions, traffic shifts, payday patterns, stock changes, and delivery disruptions. It is a before-and-after observation, even if a dashboard labels the two periods A and B.
Keep price, offers, copy, and fulfillment promises stable. Record unavoidable changes and decide whether the affected period invalidates the planned comparison. For advertisements specifically, Google Ads experiment guidance recommends minimizing campaign changes while an experiment runs; that guidance concerns ad experiments, not a universal storefront test duration.
Monitor tracking, broken images, inventory, and harmful product inaccuracies throughout. Operational checks do not justify stopping the first time a conversion chart looks favorable. Follow the planned analysis or a properly supported sequential method.
Amazon recommends completing its experiment and, when manually selecting duration, suggests eight to ten weeks in its own testing guidance. That is Amazon-specific advice. There is no universal visitor count or number of days that guarantees a trustworthy result for every product-image test.
Worked example: more purchases, the same retained units
These are invented arithmetic examples, not measured Oxava performance or evidence that AI images increase returns. Assume one order per purchasing visitor, one unit per order, complete attribution, no cancellations or exchanges, and equal, completed return follow-up.
| Measure | Image A | Image B |
|---|---|---|
| Assigned eligible visitors | 10,000 | 10,000 |
| Purchasing visitors / orders / units | 300 | 330 |
| Purchase conversion | 3.0% | 3.3% |
| Physically returned units | 15 | 45 |
| Physical-return rate | 5.0% | 13.6% |
| Retained units | 285 | 285 |
| Retained units per eligible visitor | 2.85% | 2.85% |
B's purchase conversion is 0.3 percentage points higher, equivalent to a 10% relative increase. Calling the change “0.3%” would confuse the two measures.
For A, 300 - 15 = 285; for B, 330 - 45 = 285. More purchases have not produced more retained units in this scenario. B also has more physically returned units to investigate.
These counts alone do not establish statistical significance, profit, or which image caused a mismatch. Profit analysis additionally needs costs and margins, including return handling. Keep image-production economics separate using the cost-per-approved-image worksheet.
Make the decision without overstating the evidence
Use this sequence when the planned review arrives:
- Assignment or attribution failed? Repair measurement and rerun if needed. Record the current result as unreliable.
- Purchase window or return follow-up incomplete? Keep the relevant outcome pending.
- Evidence supports a worthwhile improvement and guardrails pass? Consider adopting B within the tested surface and audience.
- Purchases improve but returns breach your predeclared limit? Investigate the image and return reasons before rollout.
- Uncertainty still includes meaningful benefit and harm? Record an inconclusive result. Retain the current image or plan another adequately designed test.
“Inconclusive” does not mean “equal.” Demonstrating practical equivalence requires an appropriate analysis and a predefined acceptable difference. Also avoid declaring a winner from whichever unplanned device or market segment happens to look best.
Frequently Asked Questions
Can I test several new product images at once?
You can compare two complete image sets, but the result belongs to the set. It cannot identify which individual picture produced the difference. Start with one intended change when you need an interpretable image-level decision.
What if my store has too little traffic?
Estimate whether the planned test can detect a commercially meaningful difference within a useful period. If it cannot, prioritize accuracy reviews and customer usability feedback, which answer different questions. Do not present a few additional orders as a reliable conversion lift.
Can native Amazon or Shopify experiments prove lower returns?
The documented experiment metrics discussed above do not supply that proof. You need a supported assignment-to-order-to-return linkage and comparable follow-up for a variant-level return analysis. Without it, limit the conclusion to the outcomes actually measured.
Should I stop a test when an image misrepresents the product?
Stop exposing shoppers to the inaccurate image and correct it. Record the interruption and its effect on the analysis. Protecting customers takes priority over completing an experiment, and the interrupted test should not be presented as a clean winner.
Test the purchase promise through to the outcome
A/B test product images with a clear surface, accurate candidates, a consistent denominator, and enough follow-up for the outcome you claim. Keep purchase results, return diagnostics, and production costs distinct, then bring them together for the adoption decision.
Open Oxava to prepare your next reviewed image candidates. Run the controlled comparison in your commerce or experimentation tools, and publish the conclusion only as broadly as your evidence allows.
Oxava Team
Egemen Küpçü is the founder of Oxava, with 10+ years of hands-on experience in 3D and visual production. He writes about the craft of generating product, brand and campaign visuals with AI.
Related Articles
ALL POSTS

Subscribe to our newsletter
Be the first to hear about new techniques, model updates and ideas on AI generation.